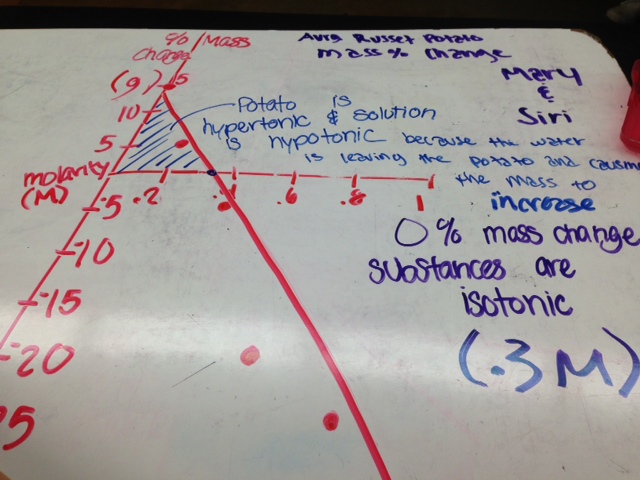
here is the graph for the average russet potato mass percentage change. We concluded that the potato is hypertonic and the solution was hypotonic because the mass increased as the molarity of solute decreased. We concluded the same thing for the sports drink because it displayed the same pattern:

After the review we talked about diffusion, and the two experiments we would be preforming in class. The first experiment required us to fill tubing with a mixture of 15% glucose, and 1% starch, and place it in a cup of pure water. After 15 minutes we would test the water and we if any glucose or starch had left the tubing (which acted like a semi-permeable membrane). The second experiment required us to use gel blocks and place them in the solution you were assigned (we got NaOH). we then measured the volume and surface area of the blocks before and after the experiment. After the experiment, we would also measure the depth of diffusion in each block.
Here are some pictures from the first experiment:

here are the glucose strips we used to test the solution and the water (the one on top is the strip we used to test the water). Brown = glucose, and Green = no glucose.

Benedicts is what we used to test the water for glucose after the 15 minutes had passed. we then mixed the benedicts with some of the water from our cup and heated it in a glass tube:

because it changed color, we concluded that glucose had left the tubing.

this is a picture of us mixing iodine with the water to test if any starch had left the tubing.

because the solution turned black after adding the iodine, we concluded that starch had not left the tubing.
Pictures from experiment two:

these are the cups filled with NaOH and the gel blocks.

this picture shows the diffusion of the NaOH into the gel after 15 minutes.
No comments:
Post a Comment